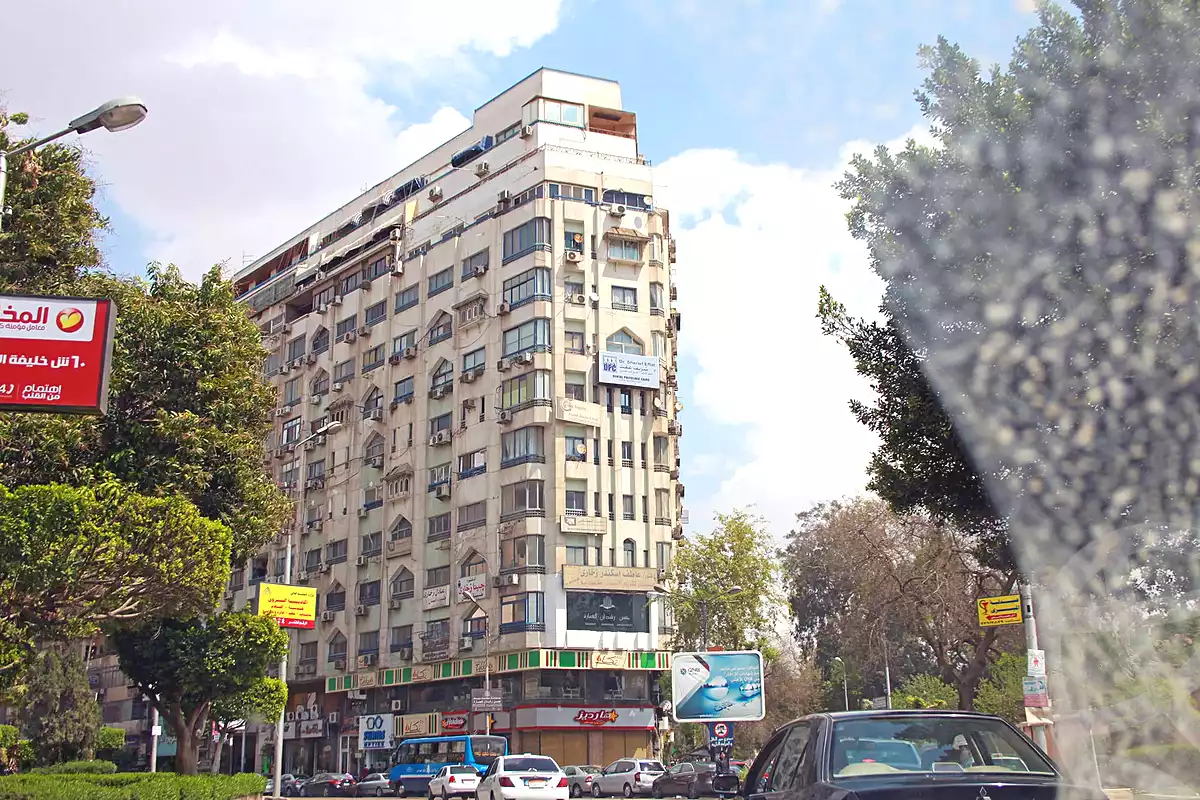
Apartments prices in El Khalifa El Maamoun St.
Avg. price per M² · Apartments
29,704EGP/M²
Updated: November 2026
Buying demand level
Average
Apartments For sale
Active listings
Price per M² – last 12 months
| Month | Average price per M² |
|---|---|
| Dec 2025 | 29,500 EGP/M² |
| Jan 2026 | 29,500 EGP/M² |
| Feb 2026 | 29,850 EGP/M² |
| Mar 2026 | 30,250 EGP/M² |
| Apr 2026 | 30,360 EGP/M² |
| May 2026 | 30,590 EGP/M² |
| Jun 2026 | 31,217 EGP/M² |
| Jul 2026 | 29,584 EGP/M² |
| Aug 2026 | 28,834 EGP/M² |
| Sep 2026 | 28,609 EGP/M² |
| Oct 2026 | 28,922 EGP/M² |
| Nov 2026 | 29,704 EGP/M² |
Highest: 31,217 EGP/M² (Jun 2026)
Lowest: 28,609 EGP/M² (Sep 2026)

Not enough Furnished Apartment price data
Choose another type above to see its prices in the same area
Not enough Chalets price data
Choose another type above to see its prices in the same area
Not enough Villas price data
Choose another type above to see its prices in the same area
Not enough Land price data
Choose another type above to see its prices in the same area
Not enough Building price data
Choose another type above to see its prices in the same area
Avg. price per M² · Commercial
70,510EGP/M²
Updated: April 2026
Buying demand level
Very high
Price per M² – last 12 months
| Month | Average price per M² |
|---|---|
| Dec 2025 | 70,510 EGP/M² |
| Jan 2026 | 70,510 EGP/M² |
| Feb 2026 | 70,510 EGP/M² |
| Mar 2026 | 70,510 EGP/M² |
| Apr 2026 | 70,510 EGP/M² |
| May 2026 | 70,510 EGP/M² |
| Jun 2026 | 70,510 EGP/M² |
| Jul 2026 | 70,510 EGP/M² |
| Aug 2026 | 70,510 EGP/M² |
| Sep 2026 | 70,510 EGP/M² |
| Oct 2026 | 70,510 EGP/M² |
| Nov 2026 | 70,510 EGP/M² |
Highest: 70,510 EGP/M² (Dec 2025)
Lowest: 70,510 EGP/M² (Nov 2026)
Not enough Administrative price data
Choose another type above to see its prices in the same area
Not enough Medical price data
Choose another type above to see its prices in the same area
About El Khalifa El Maamoun St.